Observability Platform — TracesCollecting traces from the services is an important functionality in setting up an observability platform.Jul 15, 2024Jul 15, 2024
Observability Platform — Metrics (Prometheus & Grafana)To deploy Prometheus and Grafana we can either use the Kube Prometheus Stack helm chart or the dedicated helm charts for Prometheus and…Jul 15, 2024Jul 15, 2024
Observability Platform — Components and toolsThe above diagram shows the components of an observability platform for Kubernetes-based applications and the tools we can use to build…Jul 15, 2024Jul 15, 2024
Observability Platform — IntroductionThis post is part of a series of blogs about setting up an Observability platform for an organization. This series includes the details of…Jul 15, 20241Jul 15, 20241
Connecting to Azure Kubernetes Clusters with Python: A How-To GuideConnecting to an Azure Kubernetes Service (AKS) cluster typically involves several steps, primarily setting up the Azure CLI, configuring…Jul 15, 20241Jul 15, 20241
Azure DevOps Kubernetes Agent Deployment and AutoscalingThe usual choice for a flexible self-hosted pool in Azure DevOps is to use Azure virtual machine scale sets. However, if your setup relies…Mar 27, 2024Mar 27, 2024
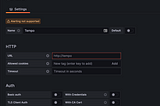
KONG API gateway Service monitoring using the Prometheus pluginKong is an API gateway and microservices management layer. It acts as a centralized entry point for managing and securing APIs, providing…Mar 25, 2024Mar 25, 2024
Kafka Kubernetes Deployment — Kafka Metrics And Monitoring (9)This is a series of articles that explains how to set up a Kafka Cluster in Kubernetes using the Strimzi Kafka operator.Mar 15, 2024Mar 15, 2024
Kafka Kubernetes Deployment — Kafka Mirror Maker 2 (8)This is a series of articles that explains how to set up a Kafka Cluster in Kubernetes using the Strimzi Kafka operator.Mar 15, 2024Mar 15, 2024